Are you struggling with inconsistent tan delta results from different test labs? Discover the hidden reasons why directly comparing damping data from different machines is a fallacy and learn how to get more reliable rubber testing data.
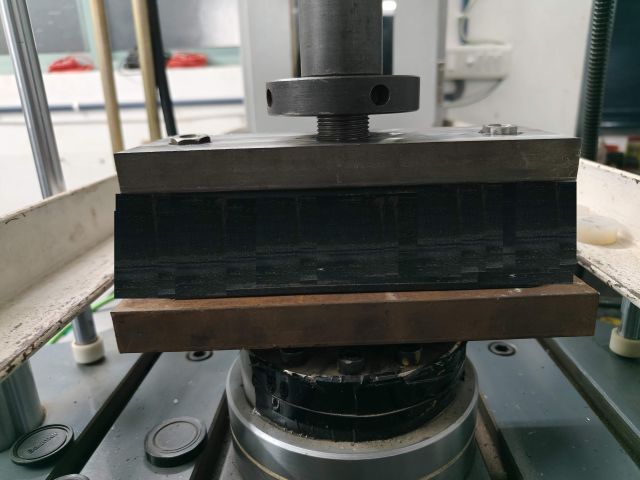
You’ve seen it before. You send a rubber engine mount to your internal lab for dynamic testing and get a tan delta value of 0.15. To verify, you send an identical part to a trusted third-party lab, and their report comes back with a value of 0.22.
Both labs are experts. Both used the same temperature, frequency, and load. So, which number is right?
The frustrating answer is: they both might be. Welcome to the apples-to-oranges trap of comparing viscoelastic properties, like tan delta and phase angle, from different test machines. The belief that these values should be identical is a common fallacy, and understanding why is key to making better engineering decisions.
The problem isn’t the rubber part; it’s the hidden personality of the machine testing it.
It’s Not Just the Rubber You’re Measuring
When you place a component in a dynamic test frame, you aren’t just measuring the properties of the rubber. You are measuring the behavior of a complete system:
The Test System = Your Rubber Part + The Machine’s Frame + The Clamps and Fixtures + The Actuator + The Sensors
The software calculates a single number for tan delta, assuming all the measured damping comes purely from your rubber part. But in reality, every other component in that system adds its own tiny “accent” to the final result.
Think of it like recording a singer’s voice. A recording made in a small, carpeted room will sound different from one made in a large, tiled cathedral, even if the singer performs identically. The test machine is the “room,” and it has its own acoustics that influence the final measurement.

Three Key Machine Differences That Skew Your Data
Let’s look at the three biggest “personality traits” of a test machine that can alter your tan delta and phase angle results.
1. The Driving Force (Actuator Technology)
Dynamic test machines create motion using different technologies. Some use high-force servo-hydraulic systems, which are like powerful weightlifters, capable of handling immense loads. Others use high-speed electro-dynamic systems, which are more like nimble gymnasts, excelling at fast, precise movements.
- A hydraulic system has to manage the flow of oil through valves to create motion. This process has its own unique response time and can introduce subtle background noise.
- An electric system uses powerful magnets and motors. It responds differently, especially at high frequencies, with its own unique electrical and mechanical characteristics.
These different “muscle types” apply the sinusoidal load in slightly different ways, leading to small but measurable variations in the phase lag they detect.
2. The Unseen Flex (Machine and Fixture Stiffness)
No material is infinitely rigid, and that includes the multi-ton steel frame of a test machine and the fixtures holding your part. When the machine applies force to your rubber mount, the machine’s own frame and fixtures flex and vibrate by a microscopic amount.
This flexing consumes a tiny bit of energy. In the world of dynamic testing, energy consumption is damping—and damping is what tan delta measures.
A massive, ultra-stiff hydraulic machine might have very little flex, adding minimal “background damping” to the reading. A lighter, high-frequency machine might be designed differently and exhibit more flex, adding a slightly higher amount of background damping. This machine-level damping gets incorrectly bundled into your part’s final tan delta value.
3. The Speed of Signal and the DAQ (Sensors and Electronics)
The machine’s “nervous system”—its load cells, position sensors, and data acquisition electronics—are incredibly fast, but not instantaneous. There are tiny, microsecond-level delays between when a force is measured and when the resulting displacement is measured.
The phase angle, which is the foundation of the tan delta calculation, is entirely dependent on this timing. Different manufacturers use different sensors, filters, and processing hardware. These minute differences in electronic delay between machines can be enough to shift the calculated phase angle by a fraction of a degree, altering the final tan delta value.
How to Build Confidence and Achieve True Comparison
So, if you can’t compare the numbers directly, what can you do? The goal is to move from comparing absolute numbers to understanding the correlation between systems.
- Standardize Your Test Conditions: This is the essential first step. Ensure that the preload, dynamic amplitude, frequency sweep, and temperature profile are absolutely identical across all tests.
- Use a “Golden Sample”: The single most effective method is to test the exact same physical part on each machine. This allows you to quantify the offset. You may find that Machine A consistently reads 5% higher than Machine B. This offset becomes your “translation key” for comparing future data.
- Characterize the Machine Itself: For the highest level of precision, you can measure the “background noise” of each machine. This involves running a full test on an ultra-stiff steel block that has virtually zero damping. Any tan delta value the machine reports is its own internal damping signature. This data can be used to create correction factors that subtract the machine’s influence from your real test results.
Conclusion: Think Correlation, Not Comparison
The next time you see differing tan delta values for the same part, don’t immediately assume one test was wrong. Instead, recognize that you’re seeing the unique signatures of two different high-performance measurement systems.
By understanding that you’re always measuring the part + machine, you can stop chasing impossible-to-achieve numerical perfection and start building intelligent, practical correlations between your test systems. This deeper understanding is what separates good data from confident, reliable engineering.
Contact Us for a Quick Quote for your material testing needs.