Testing of Composite Materials at AdvanSES Laboratory for product development, failure analysis and design optimization.
Testing of Composite Materials is crucial for product development, failure analysis and design optimization to ensure accurate and reliable results. Here are some common tests used for composite materials:
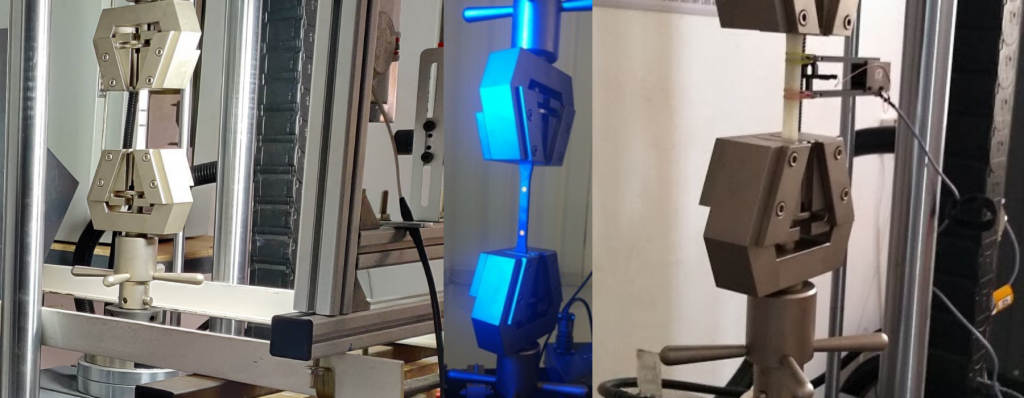
**Uniaxial Tension Test:** This test evaluates mechanical properties like yield strength, Young’s modulus, and Poisson’s ratio by stretching the material and measuring its response.
**Three-Point Bend Flexure Test (ASTM D790):** This test measures the flexural stress and strain of composite materials by loading the specimen horizontally.
**Four-Point Bend Flexure Test (ASTM D6272):** Similar to the three-point test, but with an additional loading point to apply maximum stress between the two loading points.
**Poisson’s Ratio Test (ASTM D3039):** This test determines Poisson’s ratio from strains resulting from uniaxial stress.
**Combined Loading Compression Test (ASTM D6641):** This test measures the compressive strength and stiffness of polymer matrix composite materials using a combined shear end loading.
**Axial Fatigue Test (ASTM D7791):** This test evaluates the dynamic fatigue properties of plastics and reinforced composite materials under uniaxial conditions.
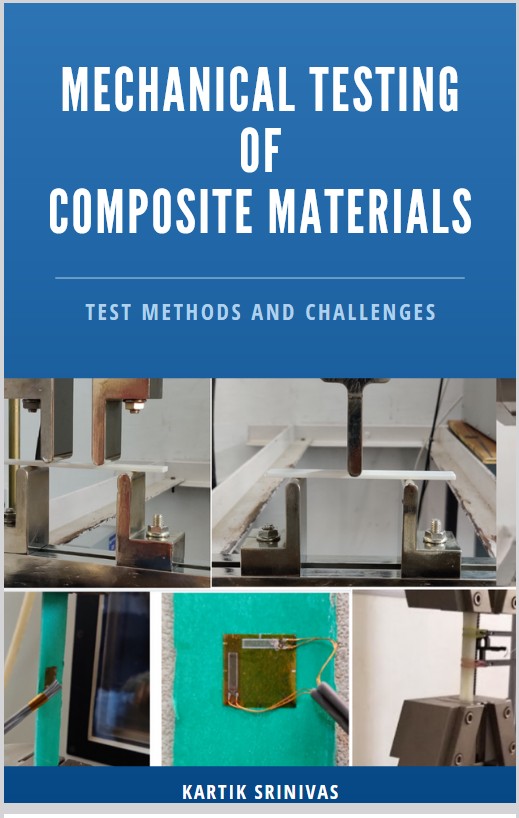
Testing of Composite Materials help in understanding the deformation characteristics and failure modes of composite materials. Check out our detailed book below for greater depth and understanding.
Advanses has the following Current Open Positions and looking to fill ASAP.
Laboratory Technician
We have openings for laboratory technicians who will assist in carrying out various testing and analysis procedures on plastics, rubbers and composite materials. This position requires a graduate degree, strong knowledge, attention to details, and the ability to work effectively in a laboratory and office setting.
Marketing Executive
We are seeking experienced marketing professionals with expertise in B2B marketing of technical and engineering services. As a Marketing Executive, you will be responsible for developing marketing strategies for online and offline, social media, generating leads, and promoting our engineering testing and simulation services.
Today in industry Fatigue Life Prediction of Rubber Components Using Critical Plane Analysis is a challenge faced by engineers across automotive, aerospace, medical, and industrial sectors. Elastomeric components like seals, mounts, and bushings operate under complex, multiaxial loads that make traditional stress- or strain-based fatigue methods unreliable.
At Advanses, we specialize in combining experimental material testing and finite element analysis (FEA) to provide accurate fatigue life predictions. In this article, we explain how critical plane methodology, tearing energy experiments, and the cracking energy density (CED) theory come together to enable reliable fatigue life assessments for rubber materials.
1. Critical Plane Methodology
Unlike metals, where equivalent stress or strain criteria can often be used, rubber fatigue is highly dependent on the orientation of crack initiation.
Critical plane analysis solves this by evaluating fatigue parameters on all possible material planes and identifying the one most prone to crack initiation. Instead of using a single scalar (like von Mises stress), this method checks the local strain energy and shear/normal contributions on every plane.
🔑 Why it matters for rubber:
Captures multiaxial load effects accurately
Identifies where cracks will start (location + orientation)
Aligns with physical fracture processes observed in elastomers
This approach is widely adopted in advanced FEA-based fatigue solvers and is a cornerstone of our fatigue services at Advanses.
2. Experimental Testing for Tearing Energy
While simulations are powerful, they must be anchored in experimental data. Rubber fatigue is fundamentally governed by the energy available to grow a crack, known as tearing energy (T).
In the lab, tearing energy is characterized through controlled crack growth tests:
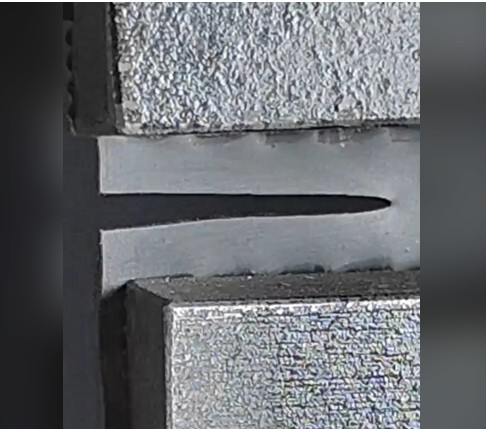
Specimens with a predefined notch are subjected to cyclic loading.
The crack growth rate (dc/dN) is measured against tearing energy.
The resulting dc/dN vs T curvebecomes the material’s fingerprint for fatigue performance.
This curve is then fed into fatigue models, ensuring that life predictions are grounded in real-world fracture mechanics. At Advanses, we conduct such tests to supply our FEA models with reliable, material-specific fatigue data.
3. Theory and Application of Cracking Energy Density (CED)
Among various fatigue parameters, Cracking Energy Density (CED) has proven most effective for rubber.
CED represents the strain energy density available on a potential crack plane, combining both normal and shear contributions. Its advantages:
Directly linked to crack initiation and growth mechanisms
Works seamlessly with critical plane analysis
Captures nonlinear, large-strain behavior typical of elastomers
Correlates strongly with experimental crack growth data
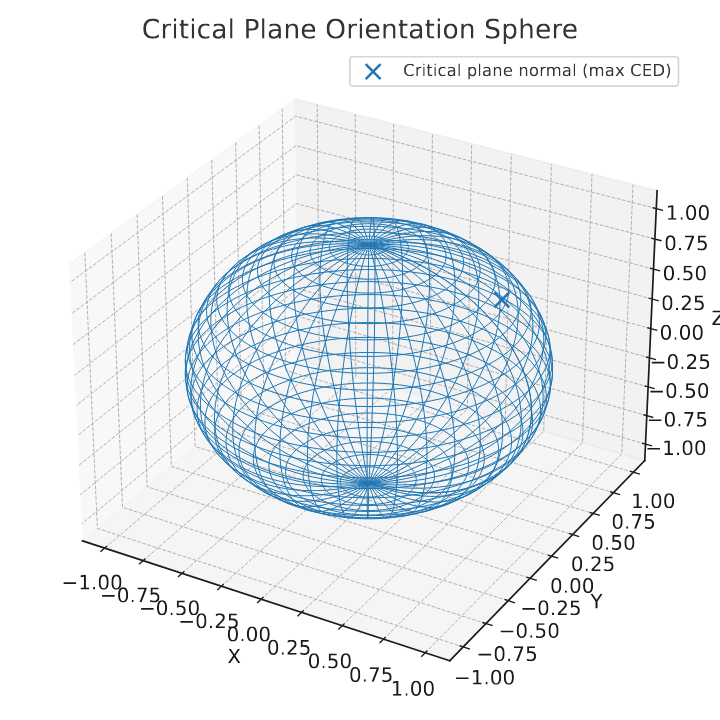
In practice, CED is calculated for each orientation plane during simulation. The critical plane with the highest damaging CED determines the predicted fatigue life.
4. Fatigue Life Prediction
By integrating critical plane analysis, experimental tearing energy data, and CED-based models, fatigue life prediction of rubber components becomes accurate and practical.
At Advanses, our workflow typically includes:
Material testing to establish dc/dN vs T curves.
FEA simulations with critical plane + CED calculations across loading histories.
Life prediction at each potential crack site, identifying the orientation and location of minimum fatigue life.
This combination ensures that predictions reflect both physics of crack growth and real-world performance, giving engineers confidence in design durability and product reliability.
Conclusion
Rubber fatigue analysis is complex — but with the right methodology, it becomes predictable.
Critical plane analysis identifies the true crack initiation plane.
Tearing energy experiments provide the experimental backbone.
Cracking energy density bridges theory with application.
Integrated FEA fatigue life prediction delivers actionable insights for design and testing.
At Advanses, we provide end-to-end fatigue testing and FEA services: from material testing to advanced simulations, ensuring your rubber components meet performance and reliability targets.
👉Contact us today to discuss how we can support your fatigue analysis needs.
Are you struggling with inconsistent tan delta results from different test labs? Discover the hidden reasons why directly comparing damping data from different machines is a fallacy and learn how to get more reliable rubber testing data.
You’ve seen it before. You send a rubber engine mount to your internal lab for dynamic testing and get a tan delta value of 0.15. To verify, you send an identical part to a trusted third-party lab, and their report comes back with a value of 0.22.
Both labs are experts. Both used the same temperature, frequency, and load. So, which number is right?
The frustrating answer is: they both might be. Welcome to the apples-to-oranges trap of comparing viscoelastic properties, like tan delta and phase angle, from different test machines. The belief that these values should be identical is a common fallacy, and understanding why is key to making better engineering decisions.
The problem isn’t the rubber part; it’s the hidden personality of the machine testing it.
Dynamic Test Setup for Frequency and Strain Sweep
It’s Not Just the Rubber You’re Measuring
When you place a component in a dynamic test frame, you aren’t just measuring the properties of the rubber. You are measuring the behavior of a complete system:
The Test System = Your Rubber Part + The Machine’s Frame + The Clamps and Fixtures + The Actuator + The Sensors
The software calculates a single number for tan delta, assuming all the measured damping comes purely from your rubber part. But in reality, every other component in that system adds its own tiny “accent” to the final result.
Think of it like recording a singer’s voice. A recording made in a small, carpeted room will sound different from one made in a large, tiled cathedral, even if the singer performs identically. The test machine is the “room,” and it has its own acoustics that influence the final measurement.
Three Key Machine Differences That Skew Your Data
Let’s look at the three biggest “personality traits” of a test machine that can alter your tan delta and phase angle results.
1. The Driving Force (Actuator Technology)
Dynamic test machines create motion using different technologies. Some use high-force servo-hydraulic systems, which are like powerful weightlifters, capable of handling immense loads. Others use high-speed electro-dynamic systems, which are more like nimble gymnasts, excelling at fast, precise movements.
A hydraulic system has to manage the flow of oil through valves to create motion. This process has its own unique response time and can introduce subtle background noise.
An electric system uses powerful magnets and motors. It responds differently, especially at high frequencies, with its own unique electrical and mechanical characteristics.
These different “muscle types” apply the sinusoidal load in slightly different ways, leading to small but measurable variations in the phase lag they detect.
2. The Unseen Flex (Machine and Fixture Stiffness)
No material is infinitely rigid, and that includes the multi-ton steel frame of a test machine and the fixtures holding your part. When the machine applies force to your rubber mount, the machine’s own frame and fixtures flex and vibrate by a microscopic amount.
This flexing consumes a tiny bit of energy. In the world of dynamic testing, energy consumption is damping—and damping is what tan delta measures.
A massive, ultra-stiff hydraulic machine might have very little flex, adding minimal “background damping” to the reading. A lighter, high-frequency machine might be designed differently and exhibit more flex, adding a slightly higher amount of background damping. This machine-level damping gets incorrectly bundled into your part’s final tan delta value.
3. The Speed of Signal and the DAQ (Sensors and Electronics)
The machine’s “nervous system”—its load cells, position sensors, and data acquisition electronics—are incredibly fast, but not instantaneous. There are tiny, microsecond-level delays between when a force is measured and when the resulting displacement is measured.
The phase angle, which is the foundation of the tan delta calculation, is entirely dependent on this timing. Different manufacturers use different sensors, filters, and processing hardware. These minute differences in electronic delay between machines can be enough to shift the calculated phase angle by a fraction of a degree, altering the final tan delta value.
How to Build Confidence and Achieve True Comparison
So, if you can’t compare the numbers directly, what can you do? The goal is to move from comparing absolute numbers to understanding the correlation between systems.
Standardize Your Test Conditions: This is the essential first step. Ensure that the preload, dynamic amplitude, frequency sweep, and temperature profile are absolutely identical across all tests.
Use a “Golden Sample”: The single most effective method is to test the exact same physical part on each machine. This allows you to quantify the offset. You may find that Machine A consistently reads 5% higher than Machine B. This offset becomes your “translation key” for comparing future data.
Characterize the Machine Itself: For the highest level of precision, you can measure the “background noise” of each machine. This involves running a full test on an ultra-stiff steel block that has virtually zero damping. Any tan delta value the machine reports is its own internal damping signature. This data can be used to create correction factors that subtract the machine’s influence from your real test results.
Conclusion: Think Correlation, Not Comparison
The next time you see differing tan delta values for the same part, don’t immediately assume one test was wrong. Instead, recognize that you’re seeing the unique signatures of two different high-performance measurement systems.
By understanding that you’re always measuring the part + machine, you can stop chasing impossible-to-achieve numerical perfection and start building intelligent, practical correlations between your test systems. This deeper understanding is what separates good data from confident, reliable engineering.
At Advanses, we specialise in material testingand finite element analysis (FEA)services for elastomeric components used in automotive, defence, aerospace, medical and industrial applications. One of the most critical design challenges our clients face is accurately predicting the fatigue life of rubber parts operating under complex, real-world loading environments.
In this article, we explore why fatigue life prediction of rubber components is widely considered difficult, and how modern critical plane analysis methods, particularly those based on cracking energy density (CED), offer a powerful and proven approach for accurate fatigue simulation and design optimisation.
Why Fatigue Life Prediction of Rubber Is Difficult
Rubber exhibits highly nonlinear, strain-dependent behaviour and undergoes large deformations that challenge traditional stress- or strain-based fatigue models used for metals. In practice, most rubber components are subjected to multiaxial loading (e.g., compression + shear + torsion), which means that fatigue initiation does not occur on a single predetermined plane but depends on the combination of local stress/strain components.
Other complicating factors include:
Strain-induced crystallisation (e.g., in natural rubber), which alters fatigue resistance
Temperature and frequency effects, which influence fatigue damage rate
Localized crack initiation, which may occur far from global stress concentration zones
These factors make simplified fatigue prediction approaches unreliable, especially when precision is required for regulatory approval or warranty confidence.
Critical Plane Analysis: A Better Approach for Elastomers
Critical plane analysis has emerged as a best-practice method for multiaxial fatigue assessment of rubber materials. Instead of relying on a global scalar value (e.g., von Mises strain), this method evaluates the fatigue parameters on all possible material planes and identifies the plane that is most susceptible to damage under the applied loading history.
Why it works so well for rubber parts:
Conventional Approach
Critical Plane Approach
Uses a single scalar equivalent stress/strain
Evaluates stresses and strains on actual material planes
Often ignores shear-dominated damage
Captures both shear and normal components
Prone to inaccurate life prediction under multiaxial loading
Delivers physically-consistent fatigue life estimation
At Advanses, we routinely apply critical plane-based fatigue analysis in our FEA projects, enabling our customers to identify where and on which plane cracks are most likely to initiate under real-world service conditions.
Cracking Energy Density (CED): A Physically-Based Fatigue Parameter
In order to quantify and accumulate damage on each plane, a fatigue damage parameter is required. While stress or strain-based amplitudes can be used, we strongly recommend Cracking Energy Density (CED) for elastomeric materials.
CED represents the amount of stored energy available to drive crack initiation and growth at a given point in the component. Because rubber fatigue is fundamentally driven by energy dissipation, CED exhibits excellent correlation with laboratory fatigue test results.
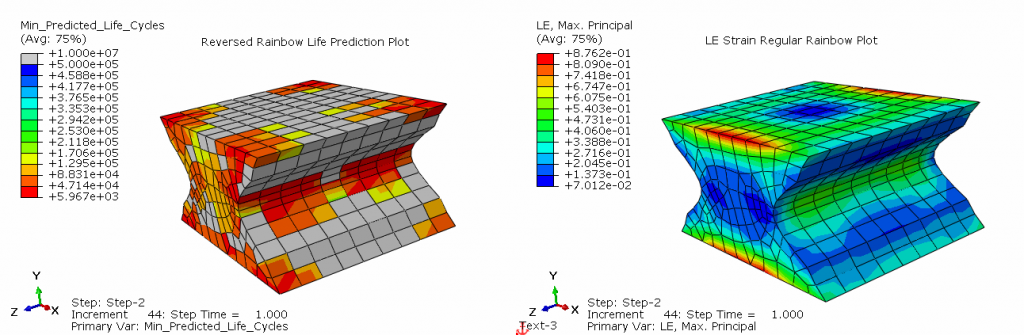
Plots showing the distribution of logarithmic strain in the part on the right hand side and the life prediction at the elemental level in the component. Reversed rainbow plotting for better visualization of results. Grey colors show infinite life and red colors show minimum life cycles.
Advantages of using CED in fatigue prediction:
Fully compatible with nonlinear material behaviour
Naturally accounts for tension-shear interaction (mode mixity)
Consistent with continuum damage mechanics
Directly applicable within a critical plane framework
By combining multi-axial loading histories (from FEA) with CED-based critical plane methods, Advanses can provide highly accurate, physics-based fatigue life prediction that matches experimental trends and helps our customers optimize geometry, material grade, and service limits.
Summary
Predicting the fatigue life of rubber components is far more complex than applying simple stress-life or strain-life models. By embracing critical plane analysis and cracking energy density-based damage parameters, engineers gain a powerful and practical toolset for making reliable life predictions, even under non-proportional and multiaxial loading.
At Advanses, we combine laboratory material testing capabilities with advanced finite element analysis to provide accurate and validated fatigue assessments for real components. Whether you require material data, fatigue test programs, or full FEA-based fatigue life prediction, our team can help you evaluate and optimise the durability of your elastomeric parts.
Contact us today if you would like to discuss your rubber fatigue analysis requirements.
1) Mechanical Testing of Plastics, Rubbers and Composite Materials 2) Endurance and Durability Testing 3) Dynamic Mechanical Analysis (DMA) of Materials and Components 4) Hyperelastic, Viscoelastic Material Characterization Testing 5) Data Cards for Input into FEA, CAE softwares 6) FEA Services 7) Custom Tests, NI Labview DAQ
The Advanses low velocity impact test system is a drop impact testing machine fully designed and developed in-house for research on composite, plastic materials. The details are as below;
Force balanced all steel structure
Maximum fall height of 2m.
High precision loadcell of 20KN capacity
Independent automatic pneumatically controlled drop system
Full configurable material sample holding fixtures able to handle samples of varied sizes.
High speed data acquisition system with data rate of 50,000 data samples in 1 second.
All test exportable in MS Excel format.
Fully benchmarked for ISO 6603 and ASTM D7136.
Advanses Low Velocity Impact Test System
Overview
The Advanses low velocity impact test system is an advanced drop impact testing machine specifically engineered for materials research. This system has been fully designed and developed in-house to provide precise testing capabilities for composite and plastic materials, ensuring reliable data for research and quality control purposes.
Key Features
Robust Construction
Force balanced all-steel structure ensuring stability during testing
Maximum fall height of 2 meters allowing for varied impact energy testing scenarios
High-Precision Measurement
Equipped with a high-precision 20KN capacity loadcell for accurate force measurements
High-speed data acquisition system capable of collecting 50,000 data samples per second
Advanced Control Systems
Independent automatic pneumatically controlled drop system for consistent test conditions
Configurable material sample holding fixtures accommodating samples of various dimensions
Data Management
Comprehensive test results exportable in Microsoft Excel format for easy analysis and reporting
User-friendly interface for efficient test setup and monitoring
Compliance
The Advanses low velocity impact test system has been fully benchmarked for compliance with international testing standards:
ISO 6603: Plastics — Determination of puncture impact behavior of rigid plastics
ASTM D7136: Standard Test Method for Measuring the Damage Resistance of a Fiber-Reinforced Polymer Matrix Composite to a Drop-Weight Impact Event
Applications
This testing system is ideal for:
Research and development of composite materials
Quality control in materials manufacturing
Performance testing of plastic components
Academic research on material impact properties
Product development and validation
Contact us to get the latest information and a quick quotation for all your testing needs.
Modeling hyperelastic materials is crucial in many engineering applications, from automotive to biomedical industries. Abaqus provides powerful tools for accurately representing the complex behavior of these non-linear materials. This guide will walk you through the essential steps of modeling hyperelastic materials in Abaqus, helping you achieve more precise and reliable simulation results.
Hyperelastic materials are characterized by their ability to undergo large deformations while maintaining the potential for complete recovery. Unlike linear elastic materials, hyperelastic materials exhibit non-linear stress-strain relationships and can experience significant shape changes without permanent deformation. Common examples include:
Rubber
Silicone
Biological tissues
Certain polymers
Steps to Model Hyperelastic Materials in Abaqus
1. Choose the Right Hyperelastic Material Model
Abaqus offers several hyperelastic material models:
Mooney-Rivlin Model
Best for rubberlike materials
Captures non-linear behavior at moderate strains
Requires two material constants
Ogden Model
Excellent for large deformations
More flexible than Mooney-Rivlin
Can model a wider range of material behaviors
Arruda-Boyce Model
Microsphere-based approach
Good for describing rubber-like materials at large strains
Minimize the difference between experimental and simulated results
Use least-squares or other advanced curve-fitting techniques
4. Implementing the Hyperelastic Material Model
5. Meshing and Boundary Conditions
Use Reduced Integration Elements: Minimize hourglassing
Apply Appropriate Boundary Conditions: Match experimental setup
Mesh Refinement: Ensure element quality for accurate results
Common Challenges and Solutions
Numerical Instabilities
Use smaller increments
Apply smooth loading conditions
Check element formulation
Material Parameter Uncertainty
Perform sensitivity analysis
Use robust parameter identification methods
Validate against multiple experimental datasets
Best Practices
Validate Your Model: Compare simulation results with experimental data
Use Multiple Testing Conditions: Uniaxial, biaxial, volumetric and planar shear tests
Document Material Parameters: Maintain clear records of constants and sources
Conclusion
Modeling hyperelastic materials in Abaqus requires a systematic approach combining experimental data, material modeling expertise, and careful simulation setup. By following these guidelines, you can develop accurate and reliable computational models of complex non-linear materials.
Additional Resources
1) Abaqus Theory and Reference Manuals
2) ASTM Standards for Rubber Testing
3) Kartik, Hyperelastic and Viscoelastic Characterization of Polymer Materials
About the Author
Kartik Srinivas, AdvanSES Laboratory K2S LLP
Keywords
Hyperelastic materials, Abaqus simulation, material modeling, non-linear materials, finite element analysis, rubber modeling, material characterization
Contact us for your material testing and FEA needs
At Advanses Laboratory, our testing and engineering team has extensively studied and tested various glass fiber reinforcements for composite materials. Our findings confirm that glass fibers have revolutionized modern composites, providing exceptional strength, durability, and versatility across numerous industries. Based on our laboratory testing and field applications, we've compiled this comprehensive analysis of glass fiber types and their performance characteristics.
Understanding Glass Fibers in Composites: Advanses Laboratory Perspective
Through our intensive materials testing program, we've determined that glass fibers function as the primary reinforcement in fiber-reinforced polymer (FRP) composites, working synergistically with the polymer matrix to create materials with superior properties. Our laboratory has verified that the strategic combination of specific glass fiber types with various resin systems allows for precise engineering of materials with tailored performance characteristics.
Major Types of Glass Fibers and Their Properties: Advanses Laboratory Test Results
At Advanses Laboratory, we've conducted extensive mechanical testing on all common glass fiber types. Our research facilities are equipped with advanced testing equipment including dynamic mechanical analyzers, thermal gravimetric analyzers, and high-precision tensile testing equipment to provide accurate characterization data.
E-Glass (Electrical Glass)
Our laboratory testing confirms that E-Glass remains the most commonly used glass fiber type, accounting for over 90% of reinforcements in composite applications worldwide. Through repeated testing protocols, we've established the following performance parameters:
Key Properties (Verified by Advanses Testing Protocols):
Chemical Resistance: Good resistance to moisture and many chemicals (verified through 1000-hour exposure testing)
Cost-Effectiveness: Most economical glass fiber option (35-45% lower cost than specialty fibers)
Applications: Our clients have successfully implemented E-Glass composites in building and construction, electrical insulation, pipes, tanks, boats, automotive parts, and general-purpose composite applications.
Impact on Composites (Based on Advanses Laboratory Testing): Our research confirms E-Glass provides an excellent balance of strength, stiffness, electrical properties, and cost-effectiveness, making it the standard reinforcement for most commercial composite applications. Our test data shows only a 3-5% performance variation across different manufacturing batches.
S-Glass (Strength Glass)
We have conducted extensive research on S-Glass, developed for high-performance applications. Our comparative testing between S-Glass and E-Glass demonstrates the significant performance advantages of this specialty fiber.
Elastic Modulus: 85-90 GPa (measured using digital image correlation techniques)
Density: 2.48-2.49 g/cm³ (determined through precision volumetric analysis)
Temperature Resistance: 15-20% better heat deflection temperature than E-Glass (verified through thermal mechanical analysis)
Cost Analysis: 3-4 times more expensive than E-Glass (based on current market analysis)
Applications: We've successfully tested formulated S-Glass composites for aerospace components, high-performance sporting goods, ballistic armor, pressure vessels, and other applications requiring superior strength-to-weight ratios. Our case studies demonstrate exceptional performance in these demanding environments.
Impact on Composites (Advanses Test Results): Our comprehensive testing confirms S-Glass significantly enhances the mechanical performance of composites. Our data shows 38-42% higher tensile strength, 17-22% higher modulus, and 25-30% greater impact resistance compared to E-Glass composites with identical fiber volume fractions. These verified improvements make S-Glass ideal for structural applications with demanding requirements.
C-Glass (Chemical Glass)
Specifically designed for chemical resistance, C-Glass excels in corrosive environments.
Key Properties:
Tensile Strength: 2,400-3,500 MPa
Elastic Modulus: 69-76 GPa
Chemical Resistance: Superior resistance to acids and chemical corrosion
Durability: Excellent performance in corrosive environments
Applications: Chemical storage tanks, pipes for corrosive fluids, chemical processing equipment, and marine applications exposed to water.
Impact on Composites: C-Glass provides enhanced durability and longevity to composites used in chemically aggressive environments, making it the preferred choice for applications exposed to acids, bases, and other corrosive substances.
D-Glass (Dielectric Glass)
D-Glass is engineered for applications requiring superior electrical properties.
Key Properties:
Dielectric Constant: Lower than E-Glass
Loss Factor: Significantly reduced electrical loss
Tensile Strength: 2,500-3,200 MPa
Boron Oxide Content: Higher than other glass types
Applications: High-performance printed circuit boards, radomes, electromagnetic windows, and other electrical applications requiring minimal signal loss.
Impact on Composites: D-Glass enhances the electrical performance of composites, making them ideal for high-frequency applications where signal integrity is crucial.
AR-Glass (Alkali-Resistant Glass)
Developed specifically to resist alkaline environments that would degrade standard glass fibers.
Key Properties:
Alkali Resistance: Excellent resistance to alkaline environments
Zirconia Content: 16-20% zirconia for enhanced durability
Tensile Strength: 1,700-3,000 MPa
Long-term Durability: Superior performance in concrete and cement applications
Applications: Reinforcement for cement and concrete structures, architectural components, and infrastructure exposed to alkaline conditions.
Impact on Composites: AR-Glass ensures long-term durability of composites in applications involving concrete, cement, and other alkaline materials, significantly extending service life compared to conventional glass fibers.
ECR-Glass (Electrical/Chemical Resistance Glass)
A modified E-Glass formulation offering enhanced acid resistance.
Key Properties:
Chemical Resistance: Superior to E-Glass, particularly against acids
Electrical Properties: Maintains good electrical insulation characteristics
Tensile Strength: 3,100-3,800 MPa
Durability: Enhanced performance in acidic environments
Applications: Chemical processing equipment, storage tanks for acidic substances, and applications requiring both electrical and chemical resistance.
Impact on Composites: ECR-Glass provides a balanced combination of electrical properties and chemical resistance, making it versatile for applications
exposed to both electrical and chemical stresses.
R-Glass (Resistance Glass)
Similar to S-Glass but with modified composition for enhanced mechanical properties.
Key Properties:
Tensile Strength: 4,400 MPa
Elastic Modulus: 86 GPa
Temperature Resistance: Improved performance at elevated temperatures
Mechanical Performance: Enhanced stiffness and strength
Applications: Aerospace structures, high-performance pressure vessels, and applications requiring high strength and temperature resistance.
Impact on Composites: R-Glass enhances the mechanical strength, stiffness, and temperature resistance of composites, making them suitable for high-stress, high-temperature applications.
How Glass Fiber Properties Influence Composite Performance
Fiber Length and Orientation
The length and orientation of glass fibers significantly impact the mechanical properties of the resulting composite:
Short Fibers (Chopped Strands):
Easier processing and molding
More isotropic properties (similar in all directions)
Lower overall strength compared to continuous fibers
Recycled Content Integration: Incorporating recycled glass into new fibers
Bio-Based Sizing Agents: Replacing petroleum-derived compounds with sustainable alternatives
Selecting the Right Glass Fiber: Advanses Laboratory Selection Methodology
At Advanses Laboratory, we've developed a proprietary selection methodology for glass fiber reinforcements based on hundreds of case studies and thousands of test specimens. Our materials engineering team recommends a systematic approach considering:
Performance Requirements: Our laboratory can quantify precise strength, stiffness, impact resistance, and fatigue performance parameters through standardized testing protocols. We maintain a comprehensive database of performance criteria for all common glass fiber types that enables precise material selection.
Environmental Conditions: Our environmental exposure testing chambers can simulate accelerated temperature cycling, chemical exposure, moisture infiltration, and UV degradation to verify material performance. Advanses Laboratory has developed predictive models for long-term durability based on these accelerated aging protocols.
Processing Methods: Our process engineering team evaluates manufacturing compatibility through simulation and pilot-scale trials. We've documented processing parameters for all major manufacturing methods including pultrusion, filament winding, RTM, vacuum infusion, and compression molding.
Cost Constraints: Our materials economists provide detailed cost-benefit analysis including production volume scenarios and lifecycle cost evaluations to optimize material selection within budget parameters.
Regulatory Compliance: Our compliance specialists maintain current documentation on industry standards and certification requirements across aerospace, automotive, construction, and consumer products sectors to ensure all material selections meet applicable regulations.
Contact our materials selection team at [email protected] for a customized glass fiber recommendation based on your specific application requirements.
Conclusion: Advanses Insights
Based on our extensive laboratory testing and field implementation experience at Advanses, we can confidently state that glass fibers remain a cornerstone of modern composite materials. Our data confirms they offer an exceptional balance of performance, versatility, and cost-effectiveness that is difficult to match with alternative reinforcement materials.
Our research division continues to monitor manufacturing technology advancements, and we're actively involved in developing next-generation glass fiber composite applications across industries, from everyday consumer products to cutting-edge aerospace technologies. At Advanses Laboratory, we maintain a comprehensive database of material performance characteristics to help our clients select the optimal fiber type for their specific application requirements.
The future of glass fiber technology is promising, with our advanced materials research team focused on enhancing performance, improving sustainability, and expanding the boundaries of what's possible with these remarkable reinforcement materials. Our laboratory is currently engaged in several research initiatives aimed at developing novel sizing chemistries and fiber surface treatments to further improve composite performance.
FAQs About Glass Fibers in Composites: Questions and Answers
Q: Can glass fiber composites be recycled? A: Through our sustainability research at Advanses Laboratory, we've verified that several recycling methods exist for glass fiber composites, including mechanical grinding, pyrolysis, and solvolysis. Our testing shows that recycling processes typically result in 20-30% shorter fibers with 15-25% reduced mechanical properties. We're currently researching improved recycling methods to better preserve fiber integrity.
Q: How do glass fibers compare to natural fibers in composites? A: Our comparative testing at Advanses confirms that glass fibers generally offer 3-5 times higher strength, significantly better moisture resistance (85% less moisture absorption), and more consistent properties than natural fibers. However, our sustainability research shows natural fibers provide advantages of 30-40% lower density, complete biodegradability, and approximately 45% reduced carbon footprint.
Q: What is the typical lifespan of glass fiber composites? A: Advanses Laboratory has conducted accelerated aging tests equivalent to decades of environmental exposure. Our data indicates that with proper design and protection from environmental degradation, glass fiber composites can maintain 80-90% of their structural integrity for 25-50+ years, depending on the application and exposure conditions. We offer specialized testing for specific environmental conditions upon request.
Q: Can glass fiber composites be used in high-temperature applications? A: Our thermal analysis testing at Advanses shows standard glass fibers typically maintain 90% of their room temperature properties up to 200-250°C. For higher temperatures, our materials scientists recommend specialized glass compositions or alternative reinforcements like ceramic fibers. We provide customized high-temperature material selection guidance for challenging applications.
Q: Are glass fiber composites electrically conductive? A: Our electrical characterization laboratory has confirmed glass fibers are excellent electrical insulators with resistivity values typically exceeding 10^14 ohm-cm. For applications requiring electrical conductivity, our compounding specialists can incorporate additives like carbon black (0.5-5% loading), metallic particles, or carbon nanotubes (0.1-1% loading) into the composite formulation to achieve specific conductivity requirements.
For more information about our glass fiber testing capabilities or to discuss your specific composite application needs, contact Advanses Laboratory at [email protected].
The Poisson’s ratio of a composite material can be determined from a tensile test. For a composite material, it is necessary to perform it in two (2) directions and to use strain gauges to measure the deformation in the direction parallel and perpendicular to the direction of the test. This test is described in ASTM D3039 standard. Typically both ASTM D638 and D3039 specimens can be used to do the tests.
Poisson’s ration Specimens for Testing
ASTM D638, ISO 527 as well as ASTM D3039 establish the test conditions for tensile testing of polymers, thermoplastics, and fiber-reinforced plastics.
Advanses Laboratory can accurately provide you with the material data and results required to fully characterize your polymeric, thermoplastic and composite materials for accurate, and reliable mateial/product development and FEA simulations.